Charts
svg_charts
A DuckDB extension that draws charts, so a chart is just a column of a query result. It returns a complete <svg> as VARCHAR: paste it into a page, or serve it as image/svg+xml. Nothing else is needed at render time — no JavaScript, no web fonts, no requests — and the same extension runs on the server and in the browser under duckdb-wasm.
WITH monthly_sales(month, sales) AS (
  VALUES ('Jan', 120), ('Feb', 148), ('Mar', 131),
         ('Apr', 175), ('May', 203), ('Jun', 188)
)
SELECT svg_line_chart(month, sales, {'background_color': '#ffffff'})
FROM monthly_sales;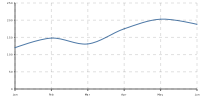
Every chart on this page is the output of the SQL above it, drawn by the extension when this README was generated. They pass 'background_color' only because they are embedded as standalone images here — leave it out and a chart is transparent and takes its colors from the page around it.
Loading it
The extension is unsigned, so DuckDB needs allow_unsigned_extensions. That is a startup-only setting — you cannot turn it on with SET once a connection is open.
| how you connect | what to set |
|---|---|
| CLI | duckdb -unsigned |
| Go | sql.Open("duckdb", ":memory:?allow_unsigned_extensions=true") |
| duckdb-wasm | db.open({ allowUnsignedExtensions: true }), between instantiate() and connect() |
Then, once per database:
INSTALL httpfs; LOAD httpfs;
INSTALL svg_charts FROM 'https://duckweb.jamesst.one';
LOAD svg_charts;
httpfs is what fetches from a custom repository; DuckDB installs it from its own repository the first time.
From a checkout of this repo you can skip the setup: nix develop puts a matching DuckDB CLI on PATH with DUCKDB_EXTENSION_REPO already pointing at a repository that carries the extension, and nix run .#duckdb opens a shell with it loaded alongside duckweb and httpfs.
Drawing one series
svg_line_chart(x, y[, options]), svg_bar_chart(...) and svg_area_chart(...) are aggregates, so they collapse a group of rows into one chart the way sum() collapses it into one number. That is the line chart above; the same data as bars:
WITH monthly_sales(month, sales) AS (
  VALUES ('Jan', 120), ('Feb', 148), ('Mar', 131),
         ('Apr', 175), ('May', 203), ('Jun', 188)
)
SELECT svg_bar_chart(month, sales, {'background_color': '#ffffff'})
FROM monthly_sales;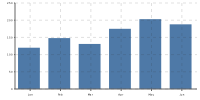
and as an area:
WITH monthly_sales(month, sales) AS (
  VALUES ('Jan', 120), ('Feb', 148), ('Mar', 131),
         ('Apr', 175), ('May', 203), ('Jun', 188)
)
SELECT svg_area_chart(month, sales, {'background_color': '#ffffff'})
FROM monthly_sales;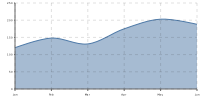
x can be a date, timestamp, boolean, number or string — it becomes the axis label, formatted for you. Because these are aggregates, GROUP BY gives you one chart per group:
SELECT regionid, svg_line_chart(ts, avg_rrp) AS chart
FROM prices_monthly
GROUP BY regionid;
Drawing several series
svg_chart(rows[, options]) takes a LIST of STRUCTs, one struct per point, which is what DuckDB’s built-in list() aggregate produces:
WITH readings(hour, nsw, qld) AS (
  VALUES (0, 82.0, 71.5), (4, 64.2, 60.1), (8, 118.7, 96.4),
         (12, 141.3, 130.8), (16, 175.6, 158.2), (20, 121.9, 112.7)
)
SELECT svg_chart(list({'hour': hour, 'nsw': nsw, 'qld': qld} ORDER BY hour),
                 {'background_color': '#ffffff'})
FROM readings;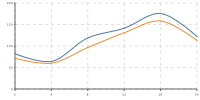
The first struct field is the x axis unless options.x names another one. Every remaining numeric field becomes a series, named after the field — those names are what appear in the tooltip and what options.series entries match on.
Values that are NULL or infinite leave a gap in the line and show as - in the tooltip.
Getting the points in order
Points are plotted in the order they arrive, and a plain aggregate over a parallel scan receives them in arbitrary order — a line chart of unsorted input comes out scrambled. Sort the input explicitly:
-- the reliable spelling: list() does the sorting
SELECT regionid, svg_chart(list({'x': ts, 'y': avg_rrp} ORDER BY ts))
FROM prices_monthly GROUP BY regionid;
svg_line_chart(ts, y ORDER BY ts) looks like the obvious spelling and does not work — it renders a single point. DuckDB’s sorted-aggregate path feeds the C API a state vector this extension cannot read correctly, and it cannot detect the case either. Use the svg_chart(list(... ORDER BY ...)) form, or sort in a subquery before the aggregate sees the rows.
Options
Options are a DuckDB STRUCT, not a JSON string, so DuckDB’s own parser checks them and you get type errors at bind time. Every field is optional, and keys are matched ignoring case and underscores (aspect_ratio and aspectRatio both work).
| key | type | default | what it does |
|---|---|---|---|
type |
'line' \| 'bar' \| 'area' |
'line' |
shape used for series that do not override it |
x |
column name | first struct field | which field is the x axis (svg_chart only) |
aspect_ratio |
number | 2.0 |
viewBox is 100 * ratio wide by 100 tall |
padding |
number | 3.0 |
margin inside the viewBox, in those same units |
background_color |
color | none (transparent) | fill behind the whole chart |
text_color |
color | 'currentColor' |
label color; inherits the surrounding page by default |
stack_offset |
'none' \| 'expand' |
'none' |
'expand' normalises each column of stacked series to 100% |
grid |
boolean | true |
horizontal grid lines |
tooltip |
'column' or false |
'column' |
pure-CSS hover tooltip listing every series at that x |
x_axis |
boolean | true |
false hides the axis and reclaims the space |
x_axis_height |
number | 8.0 |
space reserved below the plot |
x_axis_labels |
boolean | true |
false keeps the ticks, drops the text |
y_axis |
boolean | true |
false hides the axis and reclaims the space |
y_axis_width |
number | 12.0 |
space reserved left of the plot |
y_axis_ticks |
number | 5 |
tick count, clamped to 2–20 |
Per-series options
series is a list of structs. Each needs a key matching a field name in the row struct; entries naming a field that is not there are ignored. Anything left out falls back to the chart-level default.
| key | type | default | what it does |
|---|---|---|---|
key |
column name | required | which series this entry configures |
type |
'line' \| 'bar' \| 'area' |
chart type |
shape for this series alone |
stroke |
color | palette color for its position | line / outline color |
fill |
color | palette color for its position | area and bar fill |
stack_id |
string | none | series sharing an id stack on each other |
style |
'solid' \| 'dashed' |
'solid' |
line dash pattern |
border_radius |
number | 0.0 |
rounds bar corners |
smooth |
boolean | true |
false for straight segments instead of a spline |
Putting it together — a dark chart with one dashed series:
WITH quarters(quarter, revenue, cost) AS (
  VALUES ('Q1', 4.2, 3.1), ('Q2', 5.1, 3.4), ('Q3', 4.8, 3.9), ('Q4', 6.3, 4.1)
)
SELECT svg_chart(list({'quarter': quarter, 'revenue': revenue, 'cost': cost} ORDER BY quarter), {
  'aspect_ratio': 2.5,
  'background_color': '#101010',
  'text_color': '#eee',
  'y_axis_ticks': 4,
  'series': [
    {'key': 'revenue', 'stroke': '#4e79a7'},
    {'key': 'cost', 'stroke': '#f28e2b', 'style': 'dashed'}
  ]
}) FROM quarters;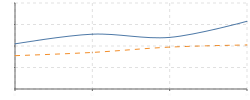
Series with no explicit color cycle through an eight-color palette, so a bare svg_chart(rows) is already legible.
Stacking
Series that share a stack_id sit on top of each other, and 'stack_offset': 'expand' turns that stack into shares of 100%:
WITH traffic(n, day, direct, search, social) AS (
  VALUES (1, 'Mon', 320, 540, 120), (2, 'Tue', 300, 610, 140),
         (3, 'Wed', 355, 580, 190), (4, 'Thu', 340, 700, 160),
         (5, 'Fri', 410, 520, 260)
)
SELECT svg_chart(
  list({'day': day, 'direct': direct, 'search': search, 'social': social} ORDER BY n),
  {
    'type': 'area',
    'background_color': '#ffffff',
    'stack_offset': 'expand',
    'series': [
      {'key': 'direct', 'stack_id': 'sources'},
      {'key': 'search', 'stack_id': 'sources'},
      {'key': 'social', 'stack_id': 'sources'}
    ]
  }) FROM traffic;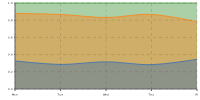
Using the output
The result is a self-contained <svg width="100%"> with a viewBox, so it scales to whatever box you drop it in and the aspect ratio decides its shape. Text defaults to currentColor and the background to transparent, which means an unstyled chart inherits your page’s colors, dark mode included. background_color is emitted as CSS on the root <svg>, which browsers honor even for an <img>, though plain rasterizers like librsvg ignore it.
Tooltips are CSS :hover rules inside the SVG, so they survive being served as a bare .svg file — but not when the SVG is used as an <img>, which is how the charts on this page are embedded.
Two things worth knowing when you size a chart:
- Every point gets an x tick and label. A few hundred points on a 200-unit-wide viewBox is a smear. Aggregate first (hourly means rather than five-minute readings), or set
'x_axis_labels': false. - Sizes are in viewBox units, not pixels:
padding,x_axis_heightandy_axis_widthare fractions of a 100-unit-tall canvas.
Version
The extension declares C extension API v1.5.6 and loads into any DuckDB that offers it; v2.0.0 is what it is built and tested against. A mismatch fails loudly at LOAD rather than misbehaving later.
How it is built
The chart engine is a Rust port of isomorphic-svg-charts: SVG built as strings, no DOM, no I/O, no dependencies. The wasm build is about 96 KB raw and 37 KB brotli, which matters because the browser downloads it on every cold load.
Working on the extension itself? svg-core/ holds the engine (no DuckDB dependency, no_std + alloc, cargo test) and src/ the DuckDB C API glue. This README is generated: edit README.template.md or docs/examples/*.sql and run nix run .#svg-charts-readme, which rebuilds the extension and redraws every chart with it.